

We have worked diligently on analyzing many months of data with products, customers, and balances in our clients’ portfolios. These dynamic insights enable our clients to draw conclusions about real growth, attrition, sales, cross-sales, product substitution, and customer behavior with added precision. That information enables financial institutions like yours to quickly assess what’s working and what’s not. And more importantly, to react quickly and accurately to changing customer behavior and market conditions.
In this issue of our newsletter, we’ll focus on showing you how looking at lost money flows gives you a far more powerful and insightful view on silent attrition, which kills growth.
90 percent of Attrition goes unreported
The average credit union and bank counts attrition based on lost customers, accounts and/or products. The problem with this approach is it leaves nearly 90% of attrition unreported. That is, the Attrition that occurs within customer relationships, products, and accounts that are still ongoing. And because of the prevalence despite its under-reporting, we label it the “silent killer” of the growth of deposit and investment portfolio balances.
Here is a chart showing the proportion of actual balance attrition associated with lost customers, lost products (customer still active), lost accounts (customer and products still active), and balance decrease attrition in ongoing accounts in ongoing relationships. As you can see the vast majority of attrition happens within relationships that are still ongoing

Some assumptions would be helpful around this significant conclusion, so bear with us while we get a little technical. First, these numbers only include deposit money that has left the financial institution. Second, they also exclude small amounts that fall within the normal day-to-day changes of banking relationships such as fees, interest, and small changes (defined as 80th percentile of observed balance changes for the product).
The data underlying the chart is a full year with a sample size of more than 100,000 customers.
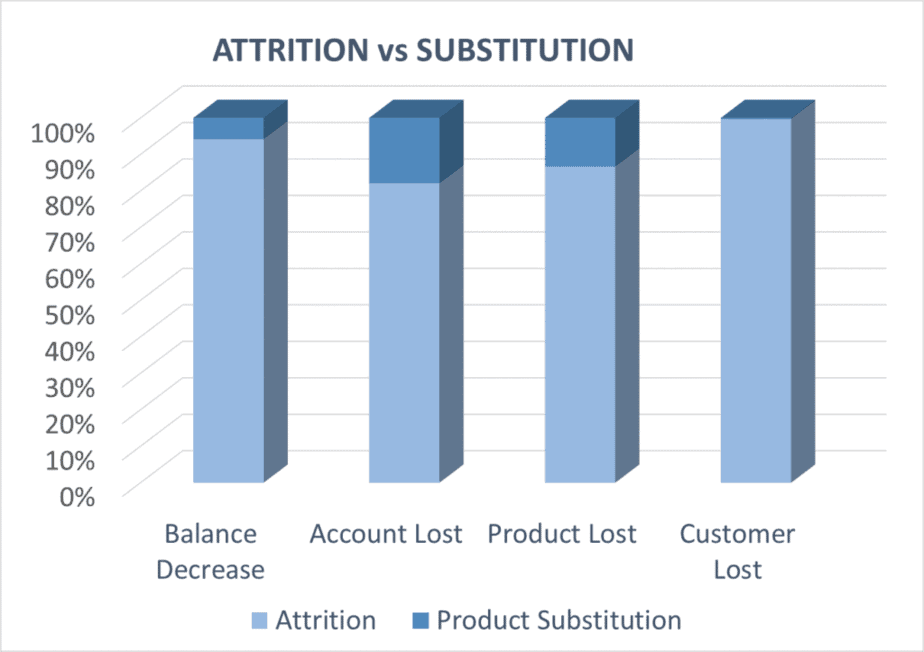
Customers frequently move money around
The figures above also exclude the effects of product substitution and renewal activity which is something most financial institutions cannot do and thus resort to proxies. As you know, in the deposits and investments space, customers frequently move money from one product to another. If you measure attrition at the total customer level, these customer insights are a non-issue, since product substitution will net to zero at the customer level – so the metrics at the customer level are 100% right, but that only addresses 5% of the attrition issue.
In contrast, at the product and account levels, product substitution creates a very large distortion in attrition analytics. The chart below shows the proportion of total balance decreases that are accounted for by product substitution versus lost money to the bank. Lost account metrics are inflated by 22% and lost product metrics by 15%, using the same data as the prior chart[1].
Two Big Conclusions
From that analysis, we draw two significant conclusions about attrition analysis and measurement.
- It is essential to understand attrition in ongoing account, product and customer relationships because…
That’s where nearly 90% of the money loss to the institution occurs.
To do this you need to be able to separate out small, normal fluctuations in customer accounts such as fees, interest and day to day variances from the significant changes that constitute true balance attrition. - You need to separate out the effects of product substitution and renewals from account level changes to understand the true cash outflows that is real attrition.
Focusing solely on product substitution will distort your understanding of customer behavior – as it relates to attrition – by 20% or more. That is, if it isn’t separated from real lost business cashflows.
Why “silent attrition” matters to you
The “so what” aspect of these conclusions is that most predictive modeling and performance reporting today is not based on pure attrition cash flows. The result is:
- misdirected investment spend on retention and
- inappropriate performance measurement for this key driver of portfolio balance growth.
It all starts by understanding what the true attrition at your institution is. Not sure how to do it? We’re happy to have this conversation with you. Our team’s vast industry knowledge working with organizations like yours. We can help you understand how product attrition and substitution behave at your institution and will share ideas on how to address them. It is time your data works as hard as you do to help you succeed.
Questions? Discover more by reaching us at FlowTracker Analytics
NOTE – Data reflected in the graphs depicted in this newsletter are for illustration purposes only and do not reflect any of our current customer’s data.
[1] It excludes account-to-account transfers within a product (i.e. renewals).